Esphome
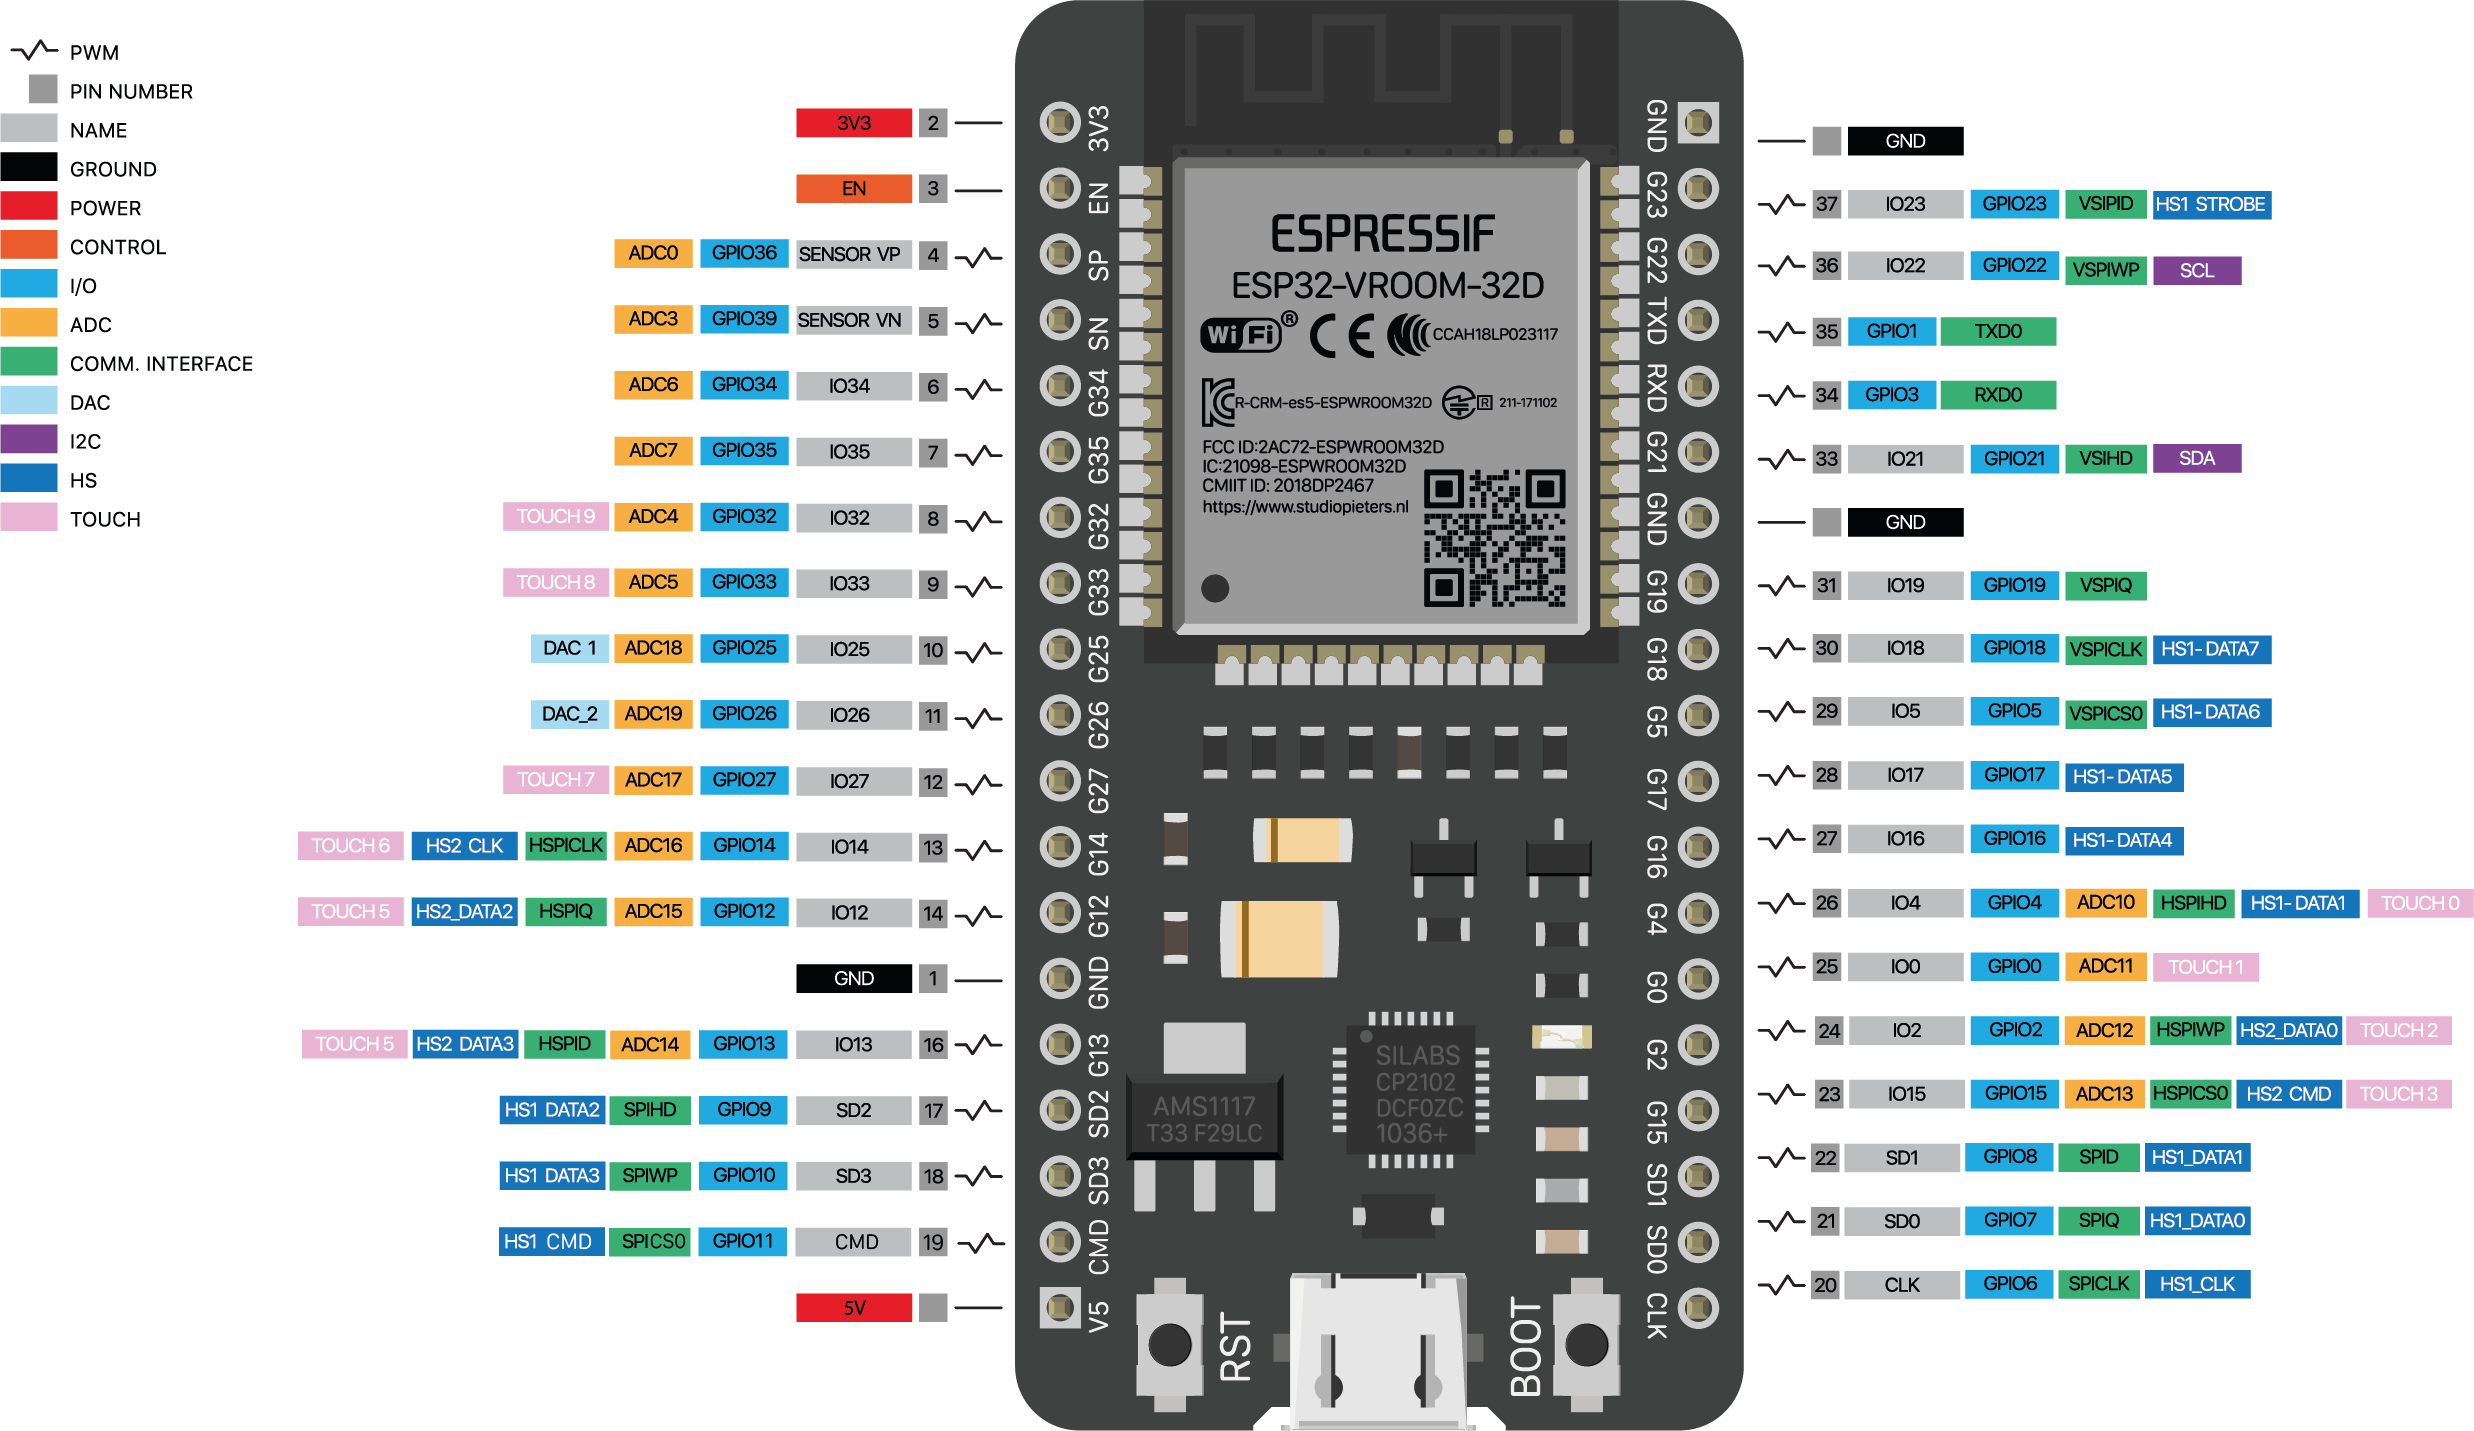
ESP32

TFT 1.8” display - ST7735
The ST7735 TFT display is a 1.8″ display with a resolution of 128×160 pixels and can display a wide range of colors ( full 18-bit color, 262,144 shades!). The display uses the SPI protocol for communication and has its own pixel-addressable frame buffer which means it can be used with all kinds of microcontroller and you only need 4 i/o pins. To complement the display, it also comes with an SD card slot on which colored bitmaps can be loaded and easily displayed on the screen.
Other features of the display include:
- 1.8″ diagonal LCD TFT display
- 128×160 resolution, 18-bit (262,144) color
- 4 or 5 wire SPI digital interface
- Built-in microSD slot – uses 2 more digital lines
- 5V compatible! Use with 3.3V or 5V logic
- Onboard 3.3V @ 150mA LDO regulator
- 2 white LED backlight, a transistor connected so you can PWM dim the backlight
- 1×10 header for easy breadboarding
- 4 x 0.9″/2mm mounting holes in corners
- Overall dimensions: 1.35″ x 2.2″ x 0.25″ (34mm x 56mm x 6.5mm)
- Current draw is based on LED backlight usage: with full backlight draw is ~50mA
The goal of this tutorial is to demonstrate the abilities of the TFT to display images and text in different colors and some animation.
Sensors
mmwave sensors
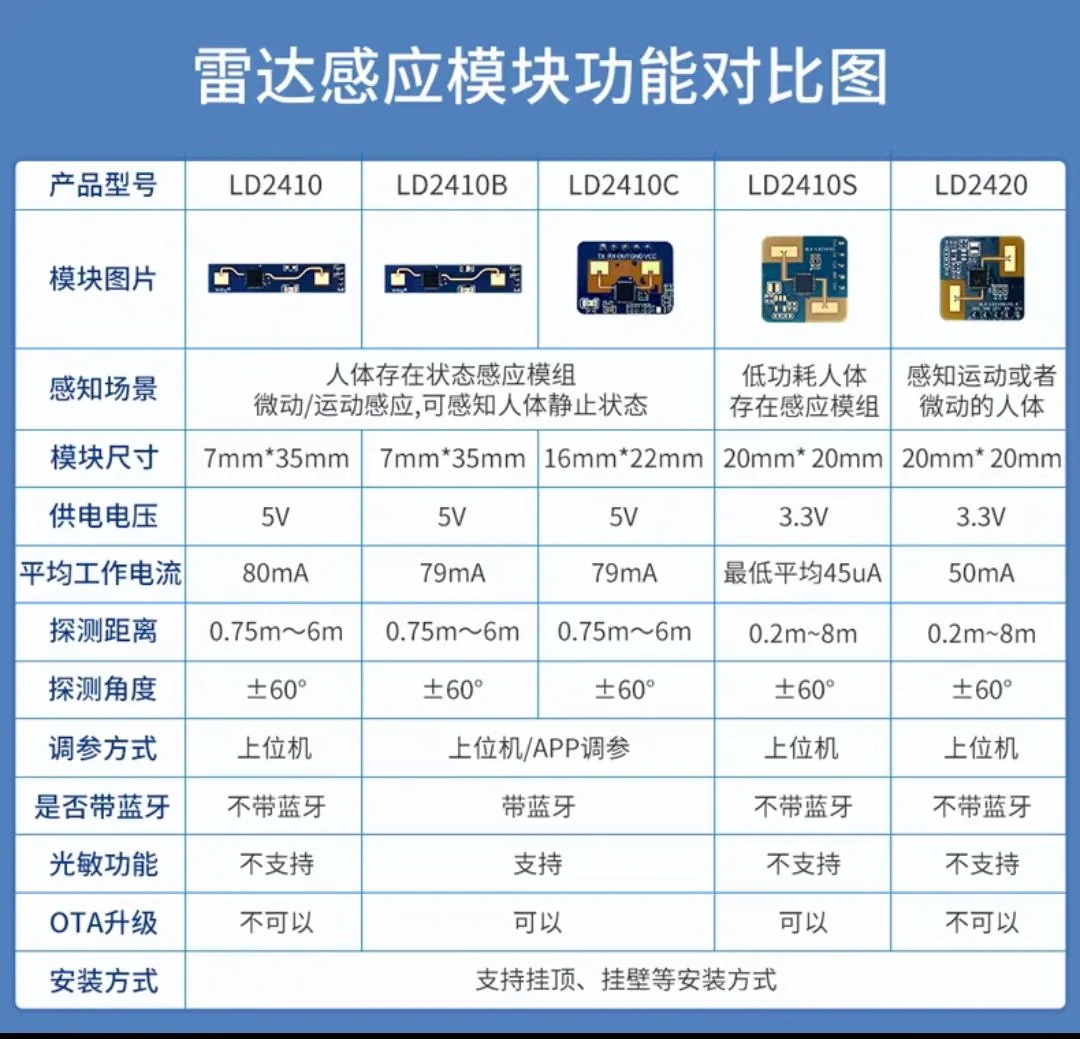
2410 can measure both static and moving targets. 2420 can only measure moving and slightly moving targets. This is a comparison diagram (in Chinese). You may use google translate.

2410, 2410B, 2410C, 2410S can all detect static targets, but not 2420. 2420 also dont have BT, dont have light sensor, and dont have OTA.
Top to down:
- Model:
- Image:
- Usage: (all can detect static targets except 2420)
- Dimension:
- Voltage:
- Avg current:
- Effective distance:
- Effective angle: (±60 for all)
- Configuration method: (all UART, use app if has BT)
- Bluetooth: (only 2410B and C has)
- Light sensor: (only 2410B and C has)
- OTA upgrade: (only 2410 and 2420 cannot)
- Installation method: (Support wall and ceiling mount)
Pinout
- LED - 3.3v
- SCK - D13
- SDA - D11
- DC - D9
- Reset - D8
- CS - D10
- GND - GND
- VCC - 5v
https://www.youtube.com/watch?v=boagCpb6DgY
Sample code
esphome:
  name: wind
  # Set inital value for idle timer
  on_boot:
    priority: -100
    then:
      - lambda: |-
          id(idle_time) = id(my_time).now().timestamp;

esp32:
  board: esp32dev
  framework:
    type: arduino

# Enable logging
logger:

# Enable Home Assistant API
api:

spi:
  clk_pin: GPIO18
  mosi_pin: GPIO23
  miso_pin: GPIO19

ota:
  password: "8aebd6eb0427929de523046d6773d66e"

wifi:
  ssid: !secret wifi_ssid
  password: !secret wifi_password

  # Enable fallback hotspot (captive portal) in case wifi connection fails
  ap:
    ssid: "Wind Fallback Hotspot"
    password: "sh1mZkRvphaJ"

captive_portal:

# All sensors sourced from HA - Ecowitt weather station sensors
text_sensor:
  - platform: homeassistant
    name: "Current Temp"
    entity_id: sensor.weather_station_temperature
    id: temp

  - platform: homeassistant
    name: "Current Wind Dir"
    entity_id: sensor.wind_direction
    id: wind_dir

  - platform: homeassistant
    name: "Current Wind Speed"
    entity_id: sensor.wind_speed
    id: wind_speed

  - platform: homeassistant
    name: "Named Wind Dir"
    entity_id: sensor.named_wind_direction
    id: named_dir

  - platform: homeassistant
    name: "Rain since 12am"
    entity_id: sensor.rain_accumulation
    id: total_rain

  - platform: homeassistant
    name: "Pressure MSL hPa"
    entity_id: sensor.atmospheric_pressure_msl
    id: pressure

  - platform: homeassistant
    name: "Wind gust"
    entity_id: sensor.wind_gust
    id: gust

# Stores timestamp of last motion detect
globals:
  - id: idle_time
    type: long

font:
  - file: "fonts/calibri.ttf"
    id: calibri_20
    size: 20

  - file: "fonts/calibri.ttf"
    id: calibri_25
    size: 25

  - file: "fonts/calibri.ttf"
    id: calibri_40
    size: 40

time:
  - platform: homeassistant
    id: my_time

    on_time:
      # Every 1 minute check if no presence trigger for 5 min
      - seconds: 0
        minutes: /1
        then:
          - if:
              # more than 5 min with no motion? Exercise display then turn off backlight
              condition:
                lambda: |-
                  return id(my_time).now().timestamp-id(idle_time) > 300;
              then:
                - display.page.show: page2
                - delay: 1s
                - display.page.show: page3
                - delay: 1s
                - display.page.show: page4
                - delay: 1s
                - display.page.show: page5
                - light.turn_off: back_light
                - delay: 1s
                - display.page.show: page1

# PIR on GPIO33
binary_sensor:
  - platform: gpio
    pin: GPIO33
    id: pir
    device_class: motion
    # turn on display on motion detect
    # store timestamp of last detection event
    on_press:
      then:
        - lambda: |-
            id(idle_time) = id(my_time).now().timestamp;
        - display.page.show: page1
        - light.turn_on: back_light
    on_release:
      then:
        - lambda: |-
            id(idle_time) = id(my_time).now().timestamp;

# backlight pin as PWM GPIO32
output:
  - platform: ledc
    pin: 32
    id: gpio_32_backlight_pwm

# define as light
light:
  - platform: monochromatic
    output: gpio_32_backlight_pwm
    name: "ILI9341 Display Backlight"
    id: back_light
    restore_mode: ALWAYS_ON

# 2.2" TFT display 320x240, portrait orientation
display:
  - platform: ili9341
    rotation: 0
    model: TFT 2.4
    dc_pin: GPIO21
    cs_pin: GPIO22
    led_pin: GPIO32
    reset_pin: GPIO17

    # Page 1 - main display.  Other pages or for anti burn-in
    pages:
      - id: page1
        lambda: |-
          // Colours - used for visiual indication of wind strength
          auto red = Color(255, 0, 0);
          auto green = Color(0, 255, 0);
          auto light_blue = Color(135, 237, 232);
          auto orange = Color(255, 170, 43);
          auto white = Color(255, 255, 255);
          auto purple = Color(97, 15, 219);
          auto grey = Color(100, 135, 135);
          // history arrays for trend display
          static float hist_wind[30];
          static int hist_dir[30];
          static int index=0;
          static int prev_index=29;
          // Convert wind direction to int, speed to float
          int dir = atoi(id(wind_dir).state.c_str());
          float speed = atof(id(wind_speed).state.c_str());
          // Calculate xy position to plot wind indicator
          int x = 120 + (90 * (cos((dir-90)*PI/180)));
          int y = 150 + (90 * (sin((dir-90)*PI/180)));
          // Store in array
          if (hist_wind[prev_index]!=speed || hist_dir[prev_index]!=dir) {
            hist_wind[index] = speed;
            hist_dir[index] = dir;
            index += 1;
            prev_index += 1;
            if (index==30) { index = 0; }
            if (prev_index==30) { prev_index = 0; }
          }
          // Trend maximum for last 30
          float max = hist_wind[0];
          for (size_t i = 0; i < 30; ++i) {
            if (hist_wind[i] > max) {
              max = hist_wind[i];
            }
          }
          // Weather data
          it.strftime(5, 10, id(calibri_25), TextAlign::TOP_LEFT, "%H:%M", id(my_time).now());
          it.printf(235, 10, id(calibri_25), TextAlign::TOP_RIGHT, "%s °C", id(temp).state.c_str());
          it.printf(5, 290, id(calibri_20), TextAlign::BOTTOM_LEFT, "G %s km/h", id(gust).state.c_str());
          it.printf(5, 310, id(calibri_20), TextAlign::BOTTOM_LEFT, "TM %2.1f km/h", max);
          it.printf(235, 290, id(calibri_20), TextAlign::BOTTOM_RIGHT, "%s mm", id(total_rain).state.c_str());
          it.printf(235, 310, id(calibri_20), TextAlign::BOTTOM_RIGHT, "%s hPa", id(pressure).state.c_str());
          // Display trend data
          for (size_t i = 0; i < 30; ++i) {
            if (hist_wind[i]>0) {
              int a = 120 + ((90-(70*hist_wind[i]/max)) * (cos((hist_dir[i]-90)*PI/180)));
              int b = 150 + ((90-(70*hist_wind[i]/max)) * (sin((hist_dir[i]-90)*PI/180)));
              int c = 120 + (90 * (cos((hist_dir[i]-90)*PI/180)));
              int d = 150 + (90 * (sin((hist_dir[i]-90)*PI/180)));
              it.line(a, b, c, d, grey);
            }
          }
          // Compass rose
          it.circle(120, 150, 90);
          it.print(120, 50, id(calibri_20), red, TextAlign::BOTTOM_CENTER, "N");
          it.print(120, 250, id(calibri_20), red, TextAlign::TOP_CENTER, "S");
          it.print(20, 150, id(calibri_20), red, TextAlign::CENTER_RIGHT, "W");
          it.print(220, 150, id(calibri_20), red, TextAlign::CENTER_LEFT, "E");
          // Wind pointer
          if (speed<=11) { it.filled_circle(x, y, 7, light_blue); }
            else {
          if (speed>11 && speed<=30) { it.filled_circle(x, y, 7, green); }
            else {
          if (speed>30 && speed<=60) { it.filled_circle(x, y, 7, orange); }
            else {
          if (speed>60) { it.filled_circle(x, y, 7, red); }
            } } }
          // Wind details
          it.printf(120, 130, id(calibri_25), TextAlign::BOTTOM_CENTER, "%s", id(named_dir).state.c_str());
          if (speed<10) { it.printf(120, 175, id(calibri_40), TextAlign::BOTTOM_CENTER, "%2.1f", speed); }
            else { it.printf(120, 175, id(calibri_40), TextAlign::BOTTOM_CENTER, "%2.0f", round(speed));
          }
          it.print(120, 175, id(calibri_20), TextAlign::TOP_CENTER, "km/h");

      - id: page2
        lambda: |-
          // fill screen red
          auto red = Color(255, 0, 0);
          it.fill(red);

      - id: page3
        lambda: |-
          // Fill screen green
          auto green = Color(0, 255, 0);
          it.fill(green);

      - id: page4
        lambda: |-
          // Fill screen white
          auto white = Color(255, 255, 255);
          it.fill(white);

      - id: page5
        lambda: |-
          it.fill(COLOR_OFF);
Source: https://community.home-assistant.io/t/mini-weather-station-display-esphome-updated-for-3-2-touchscreen-with-bom-forecast/390606
Comments